Application Monitoring with Container Insights (CloudWatch)
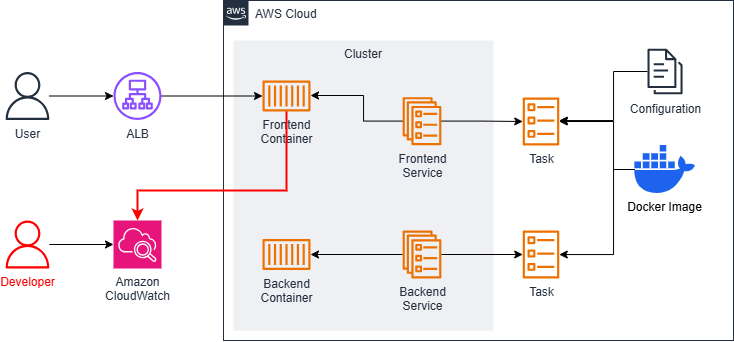
To complete this section correctly, you must have successfully configured and run the CI/CD steps beforehand.
Configuring Container Insights
First, in this section, we need to configure some settings before we can use Container Insights. Container Insights is a service that allows us to monitor metrics like CPU usage, Network traffic, etc., from which we can infer user activity over a specific time period.
Combined with CloudWatch, we can view logs sent from containers as log groups, typically with a group name starting with /ecs/*. This provides an overview of applications in the system, such as their performance, alerts, or if an application encounters an error. We can also examine these logs to find the cause or investigate unusual traffic in case of system intrusion.
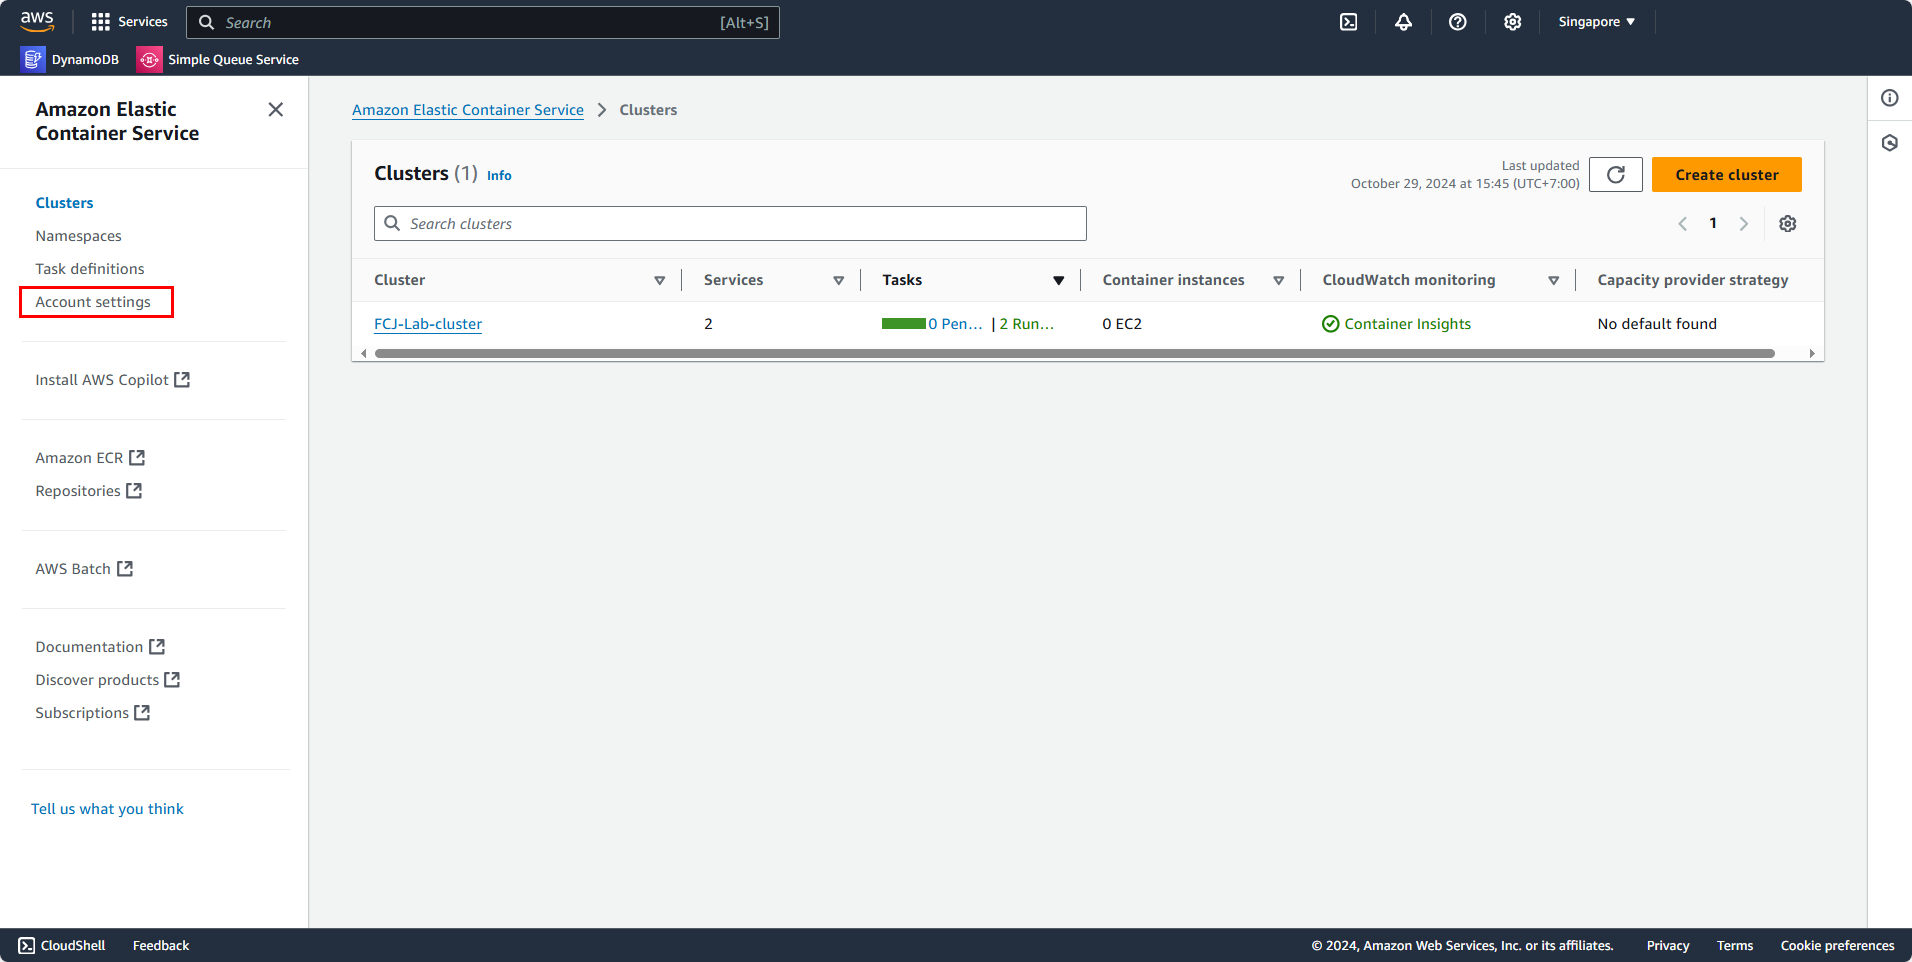
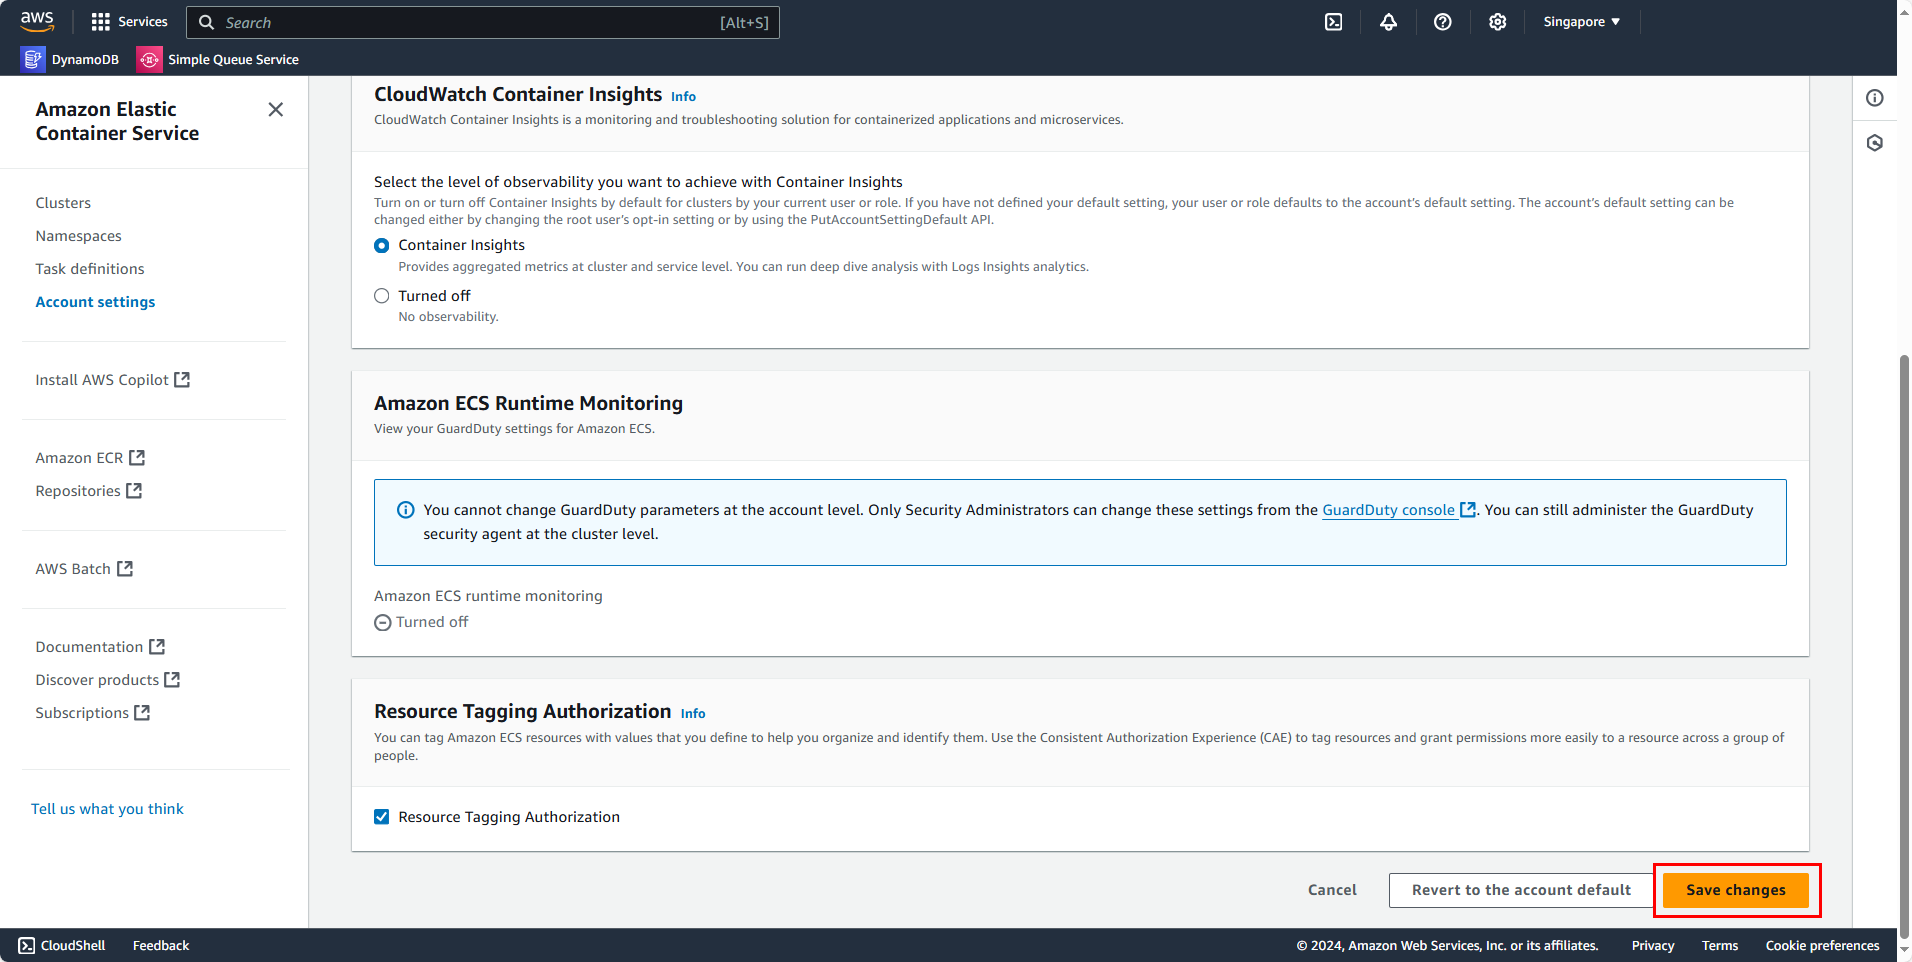
First, go to the ECS console, and in the right-hand menu, select Account settings.
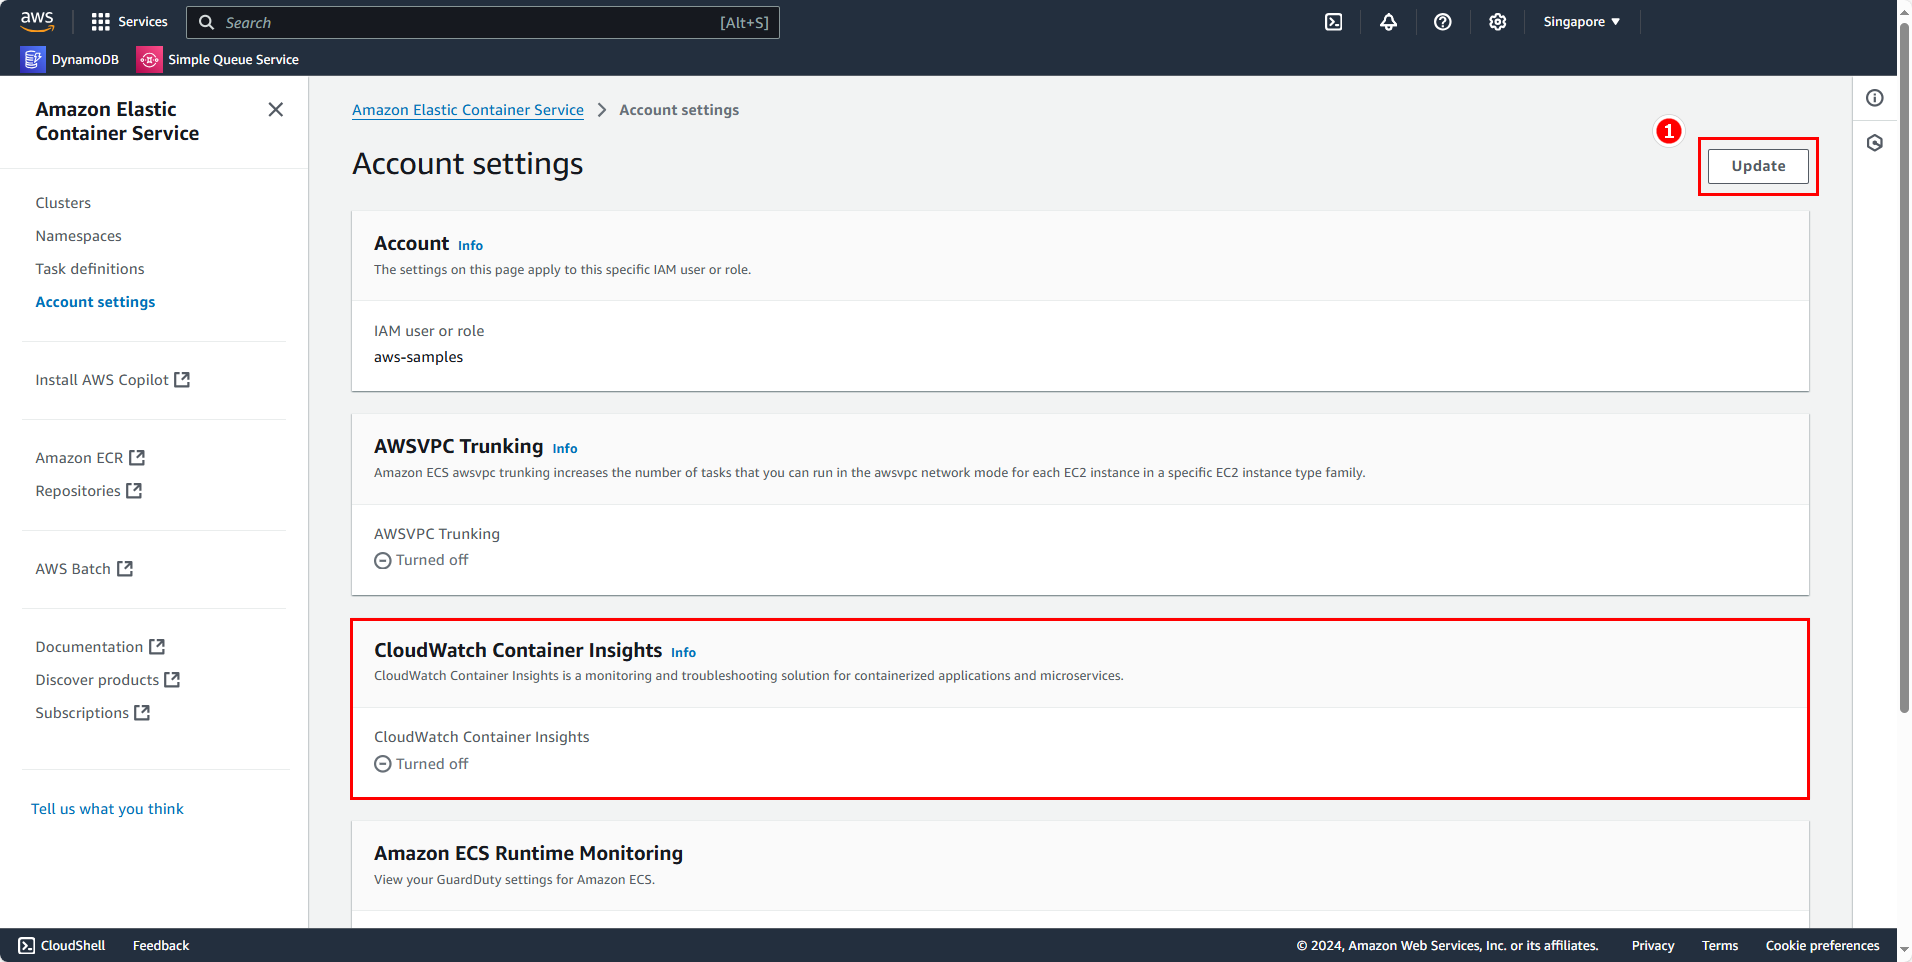
In the Account settings section, look for CloudWatch Container Insights with a Turned off status, then select Update.
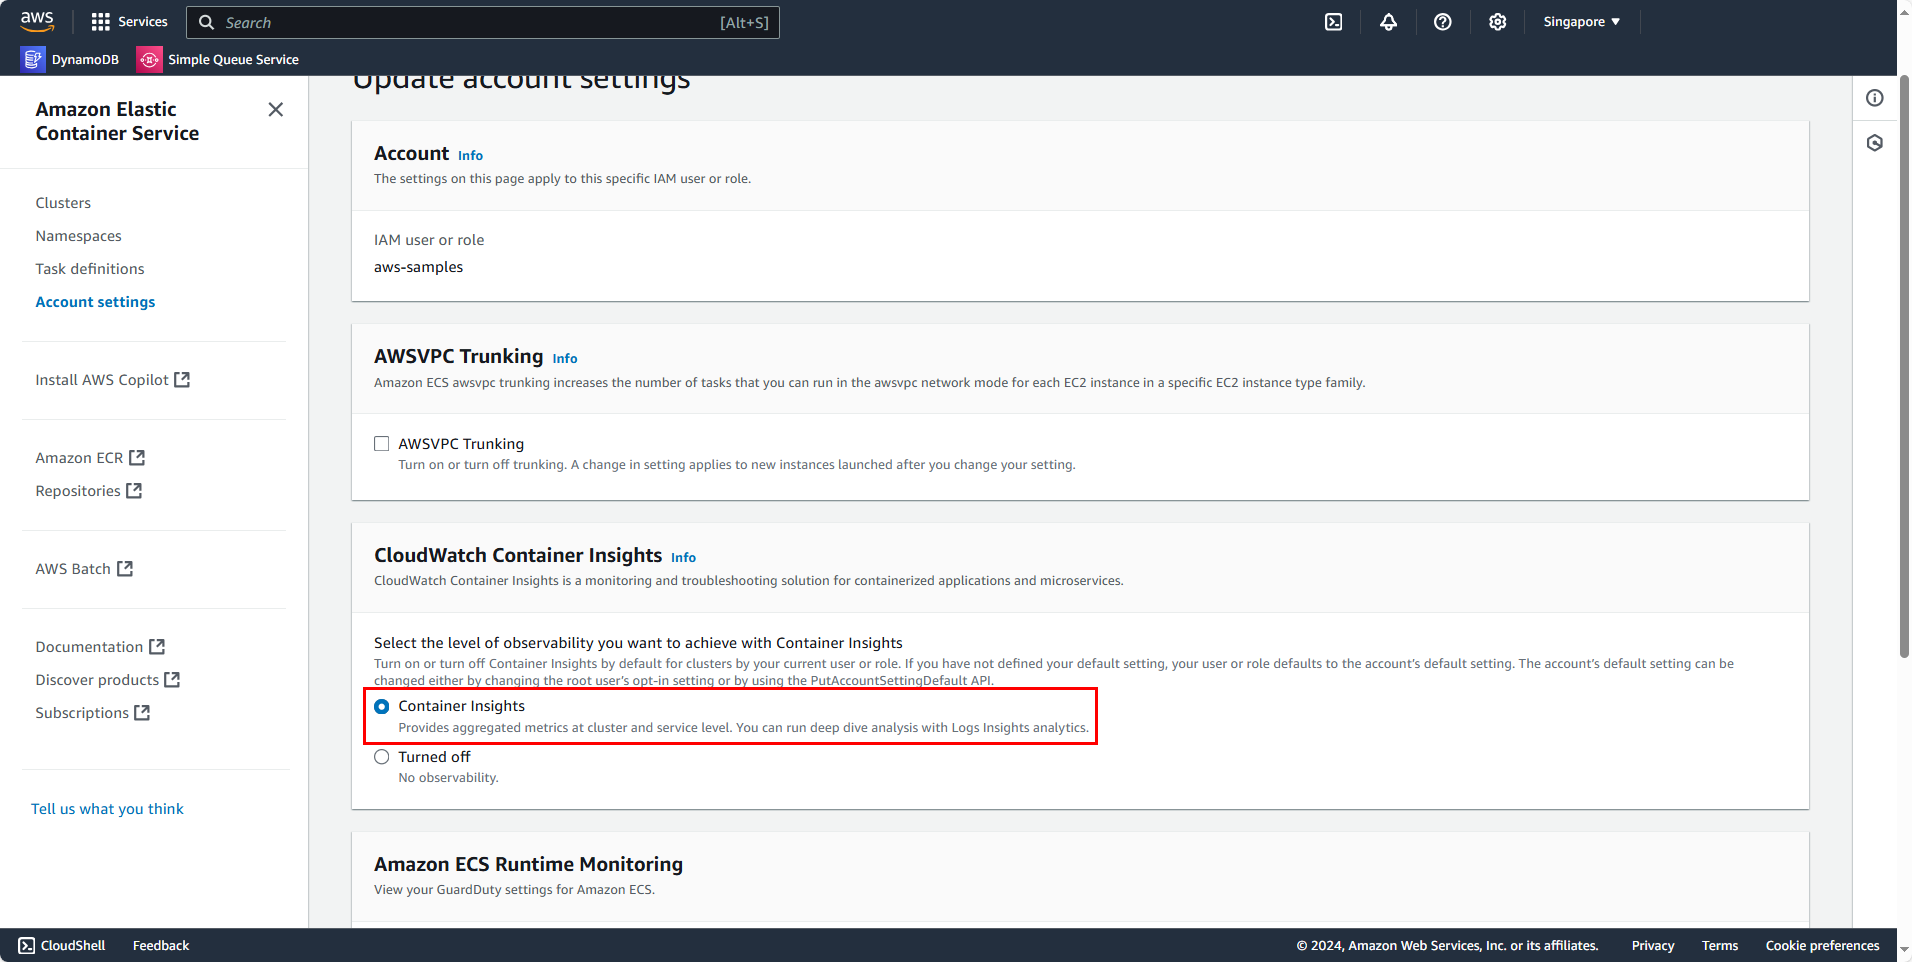
Check Container insights and click Save changes.
Observing Metrics with Performance Monitoring
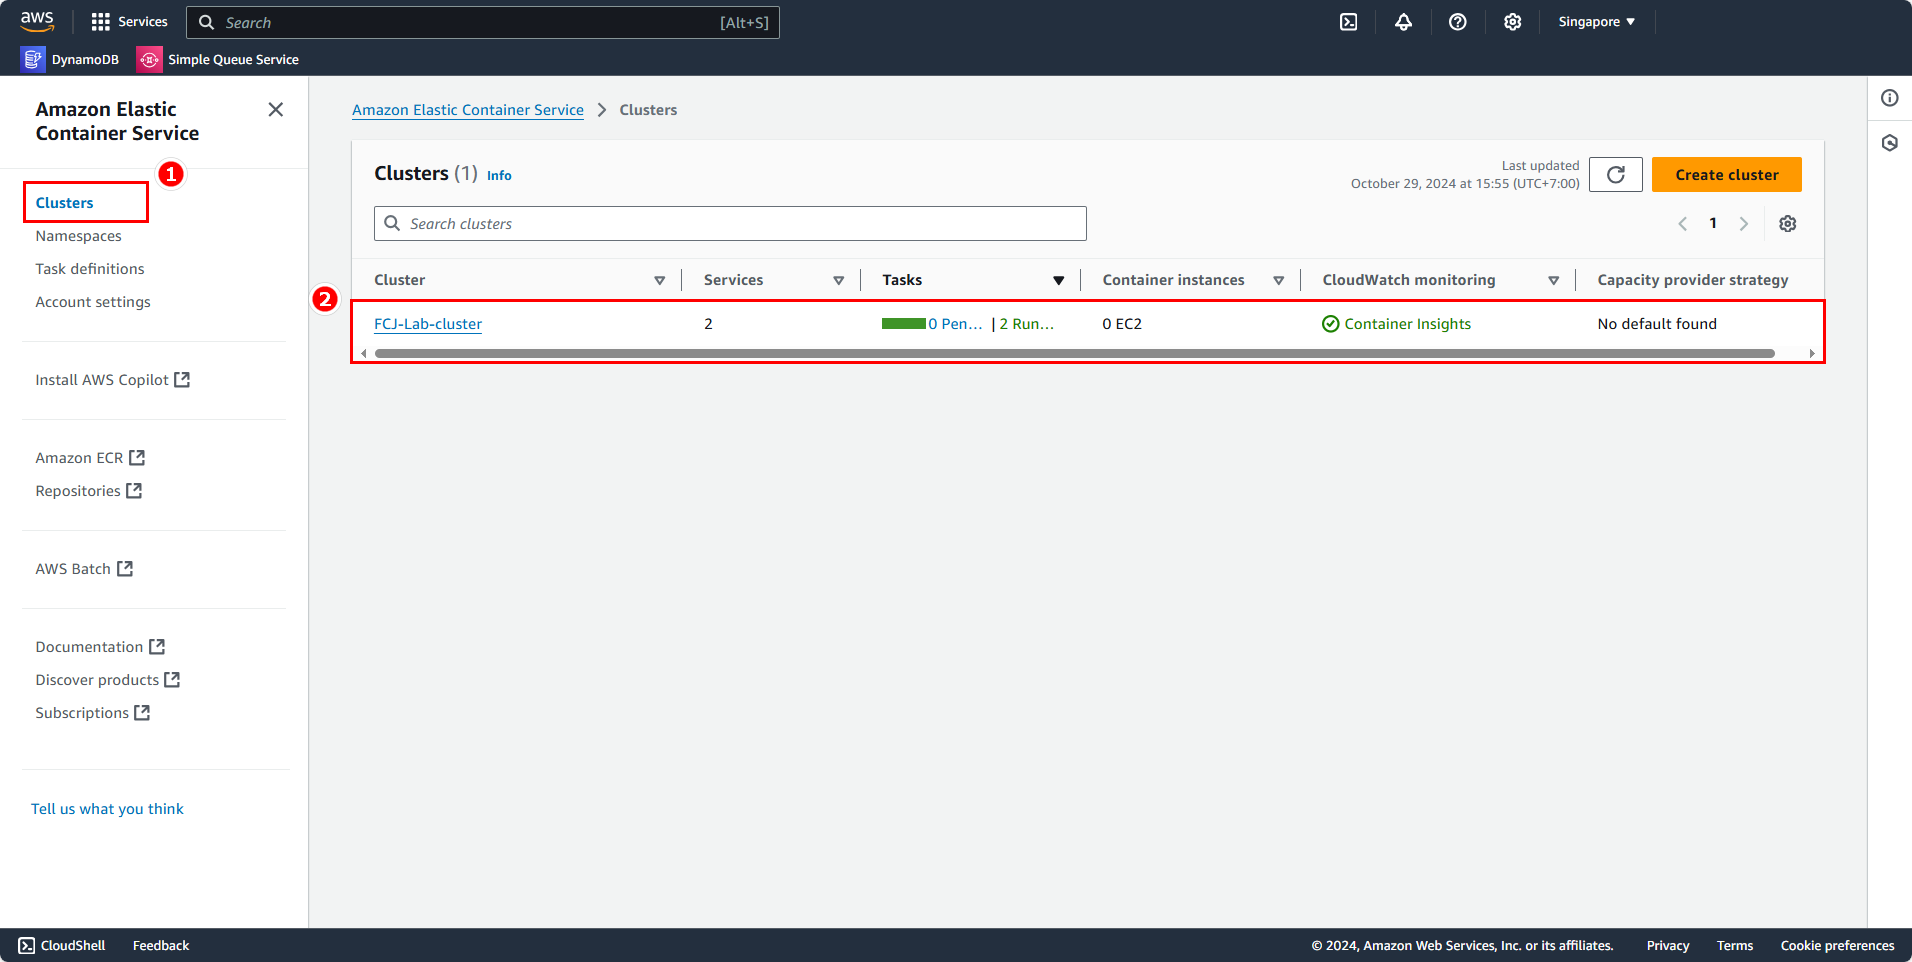
Return to the Cluster tab, and go to your cluster.
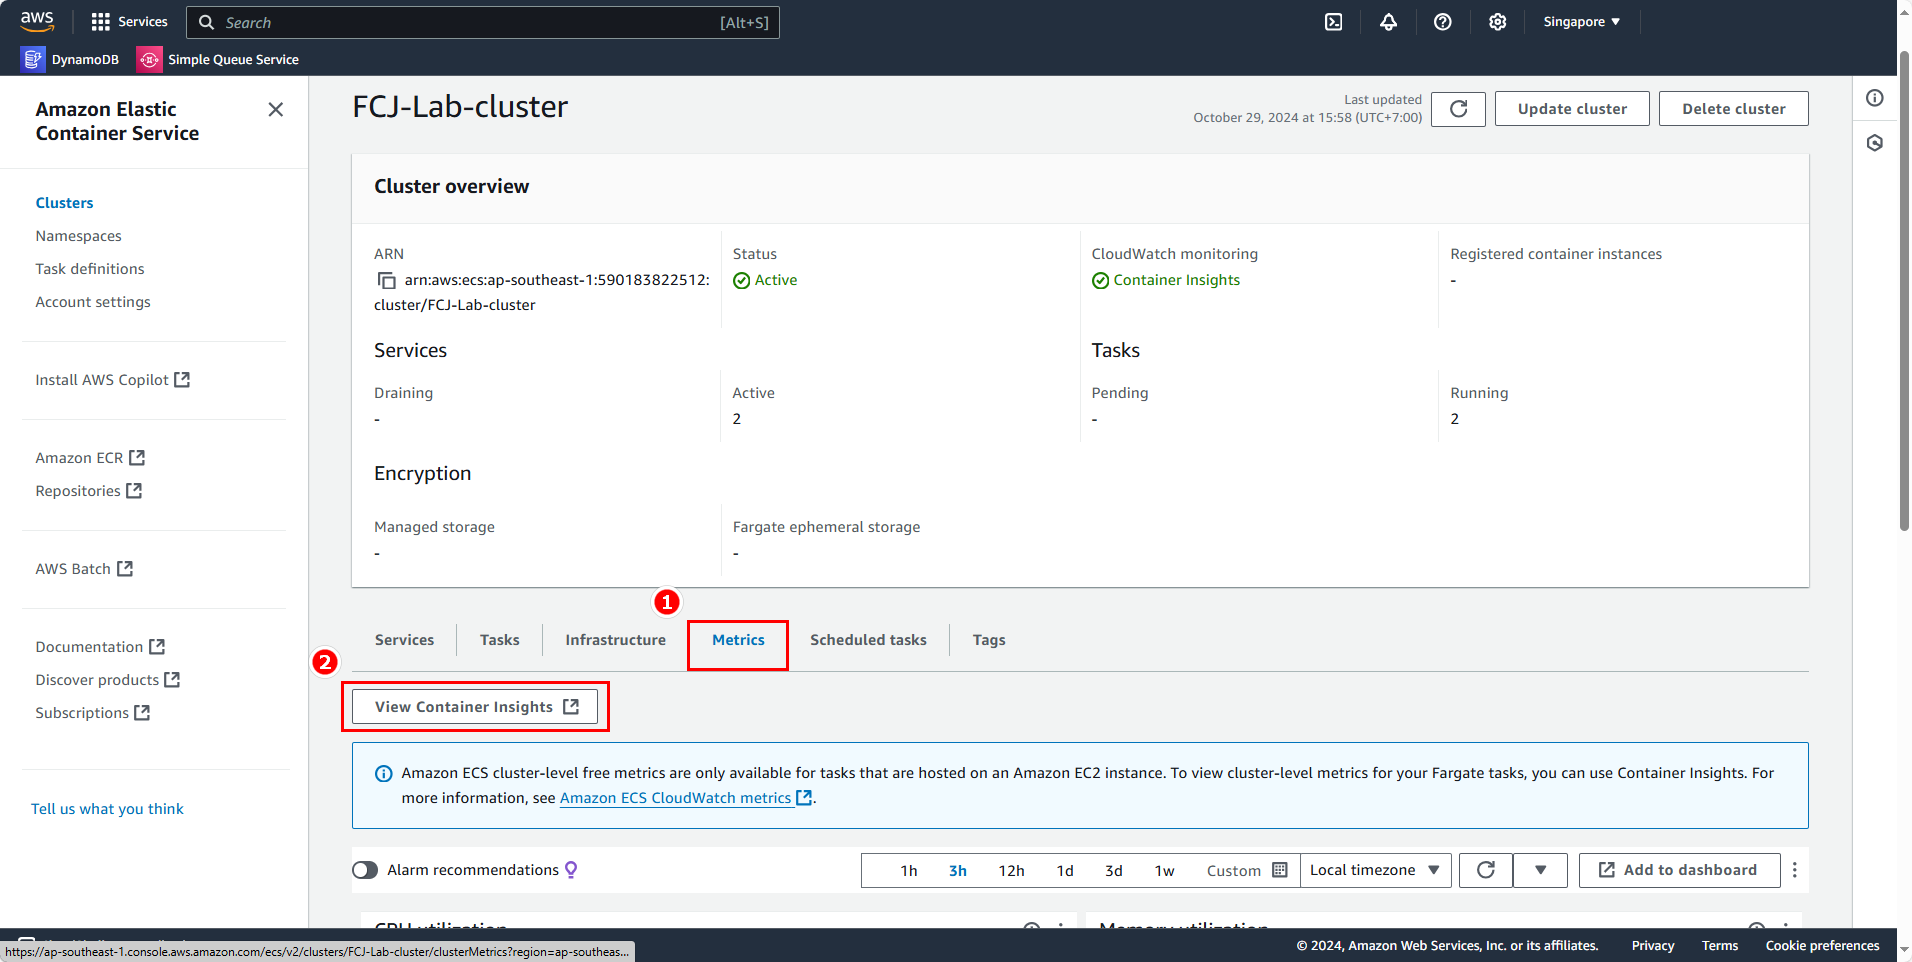
Open the Metrics tab and select View Container Insights.
The Container Insights page will then appear.
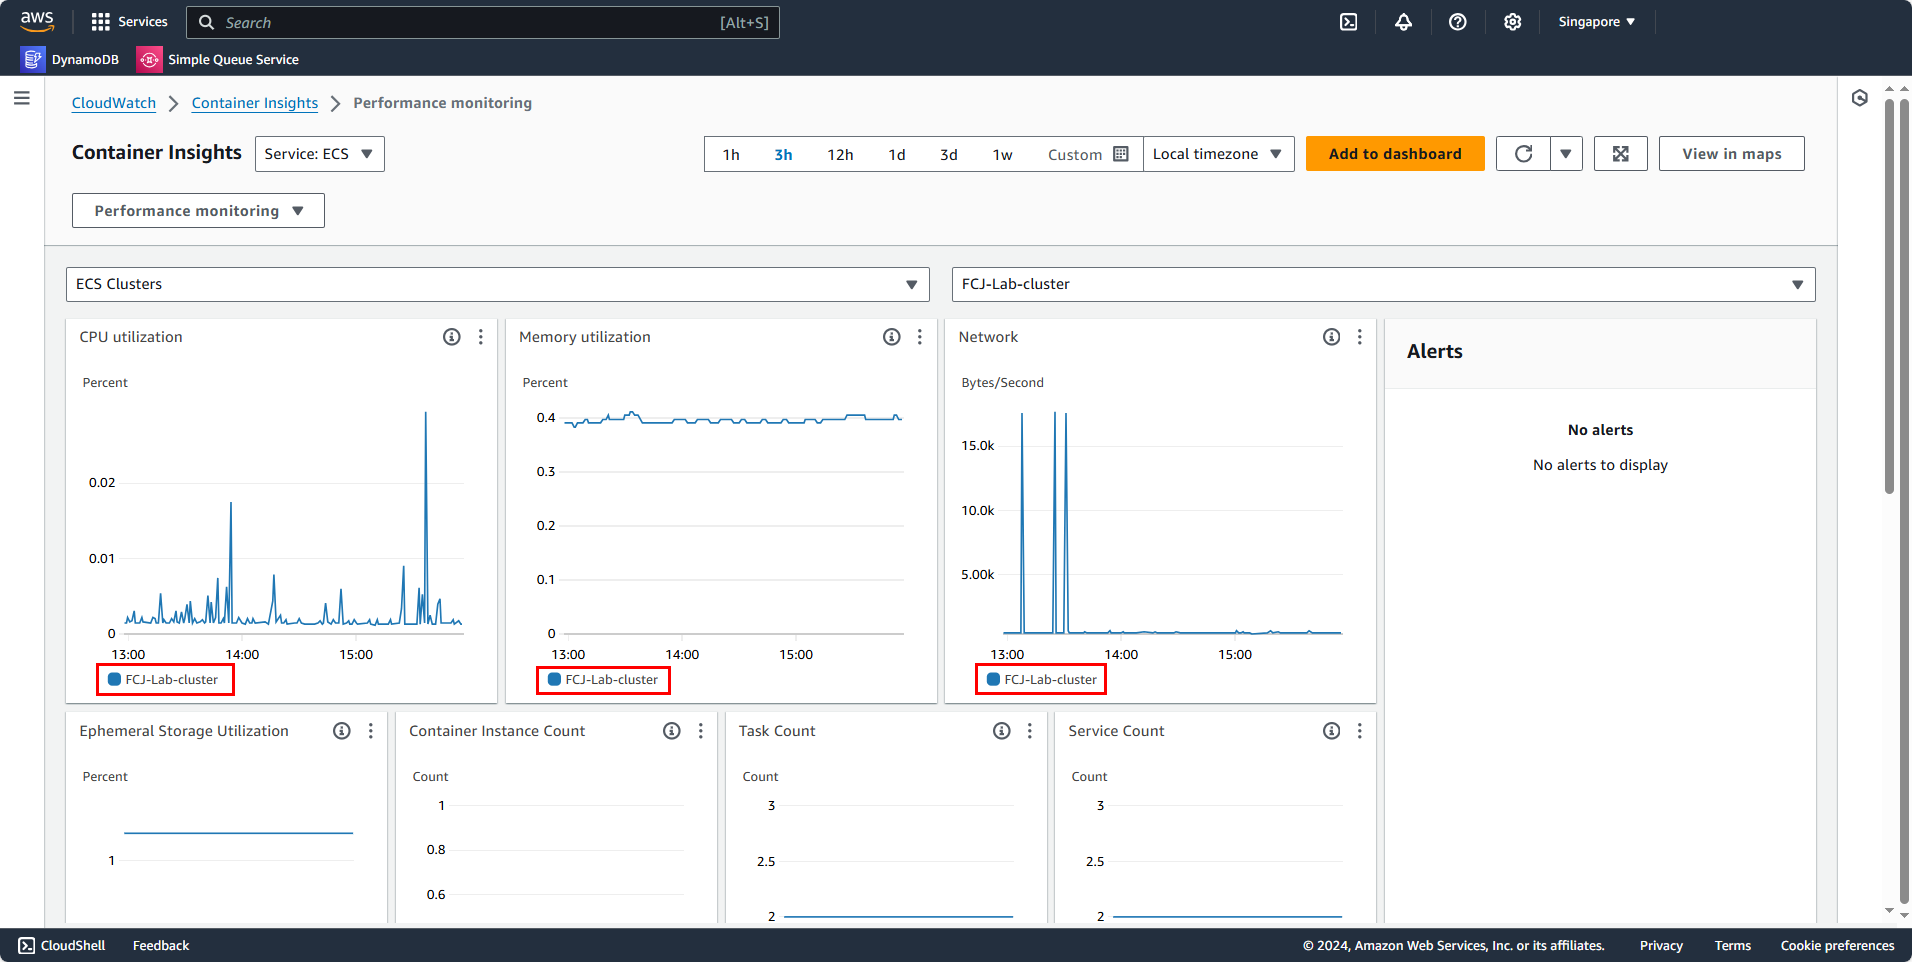
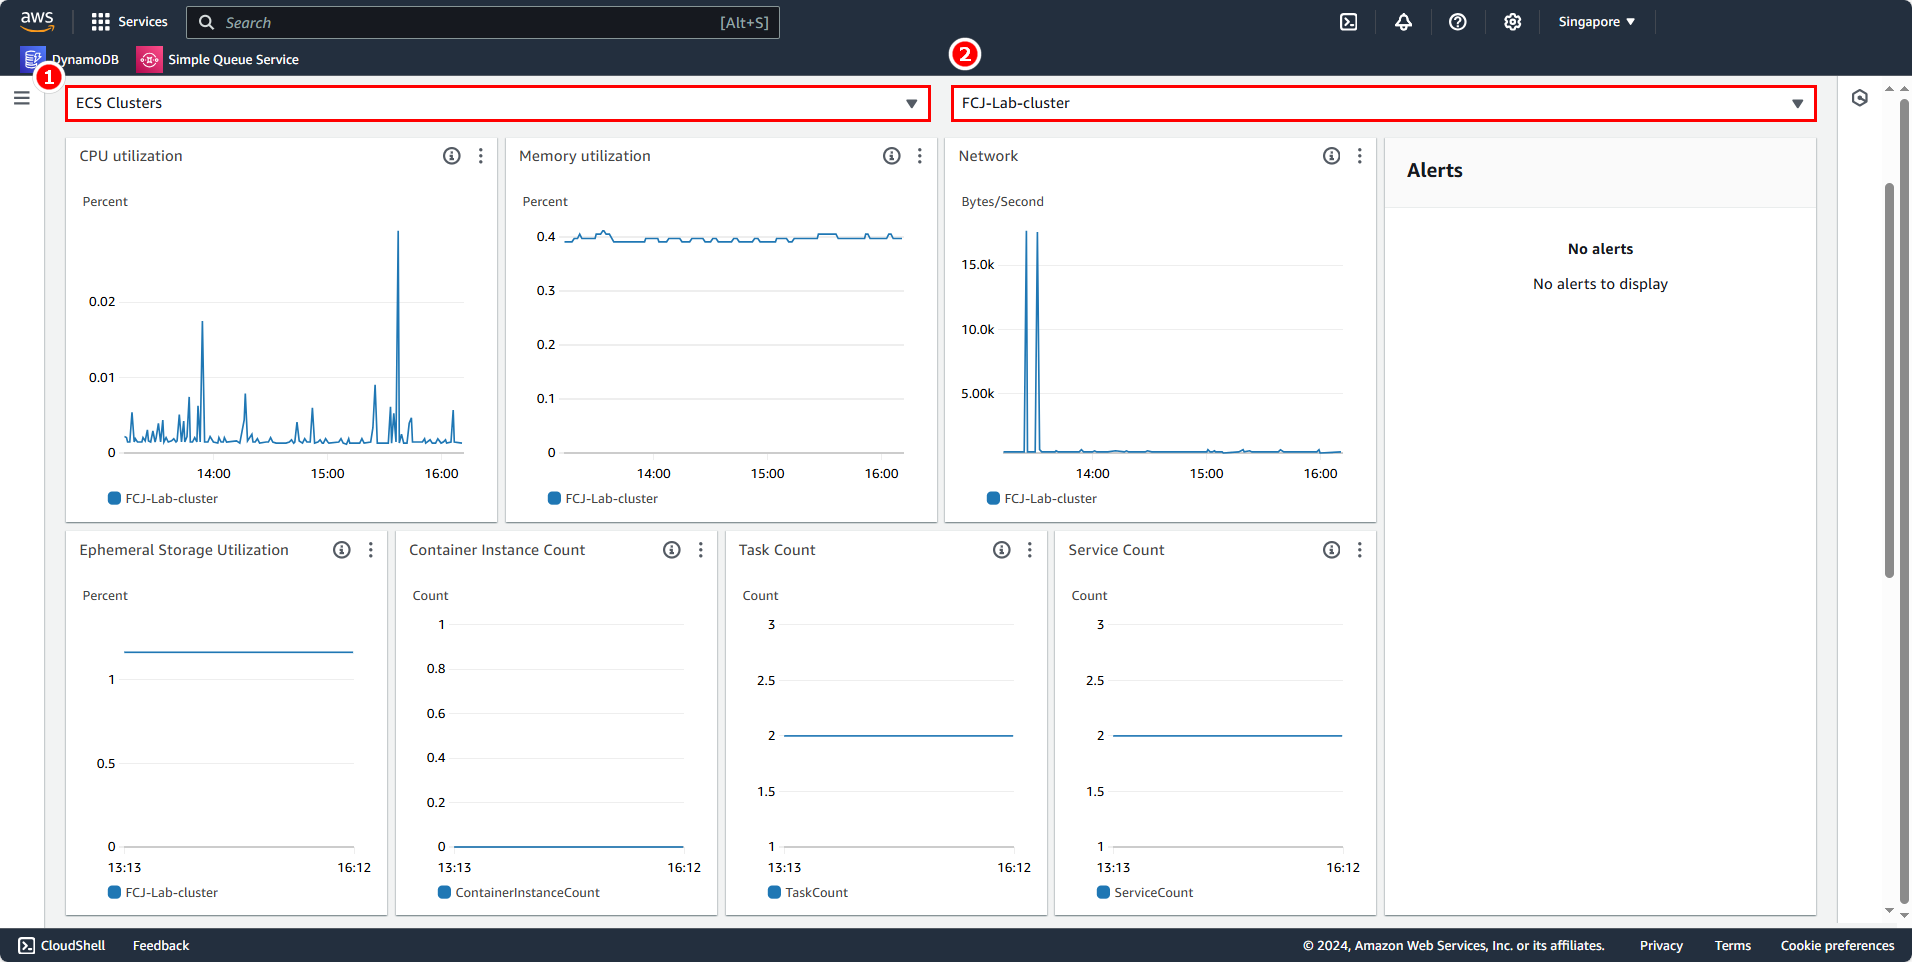
Here, you can see the metrics for the cluster we previously deployed, FCJ-Lab-cluster, if there’s only one cluster in the region where we created it.
To view information for other clusters:
- On the left selector, choose ECS Cluster.
- On the right selector, select the cluster we created, in this case, FCJ-Lab-cluster.
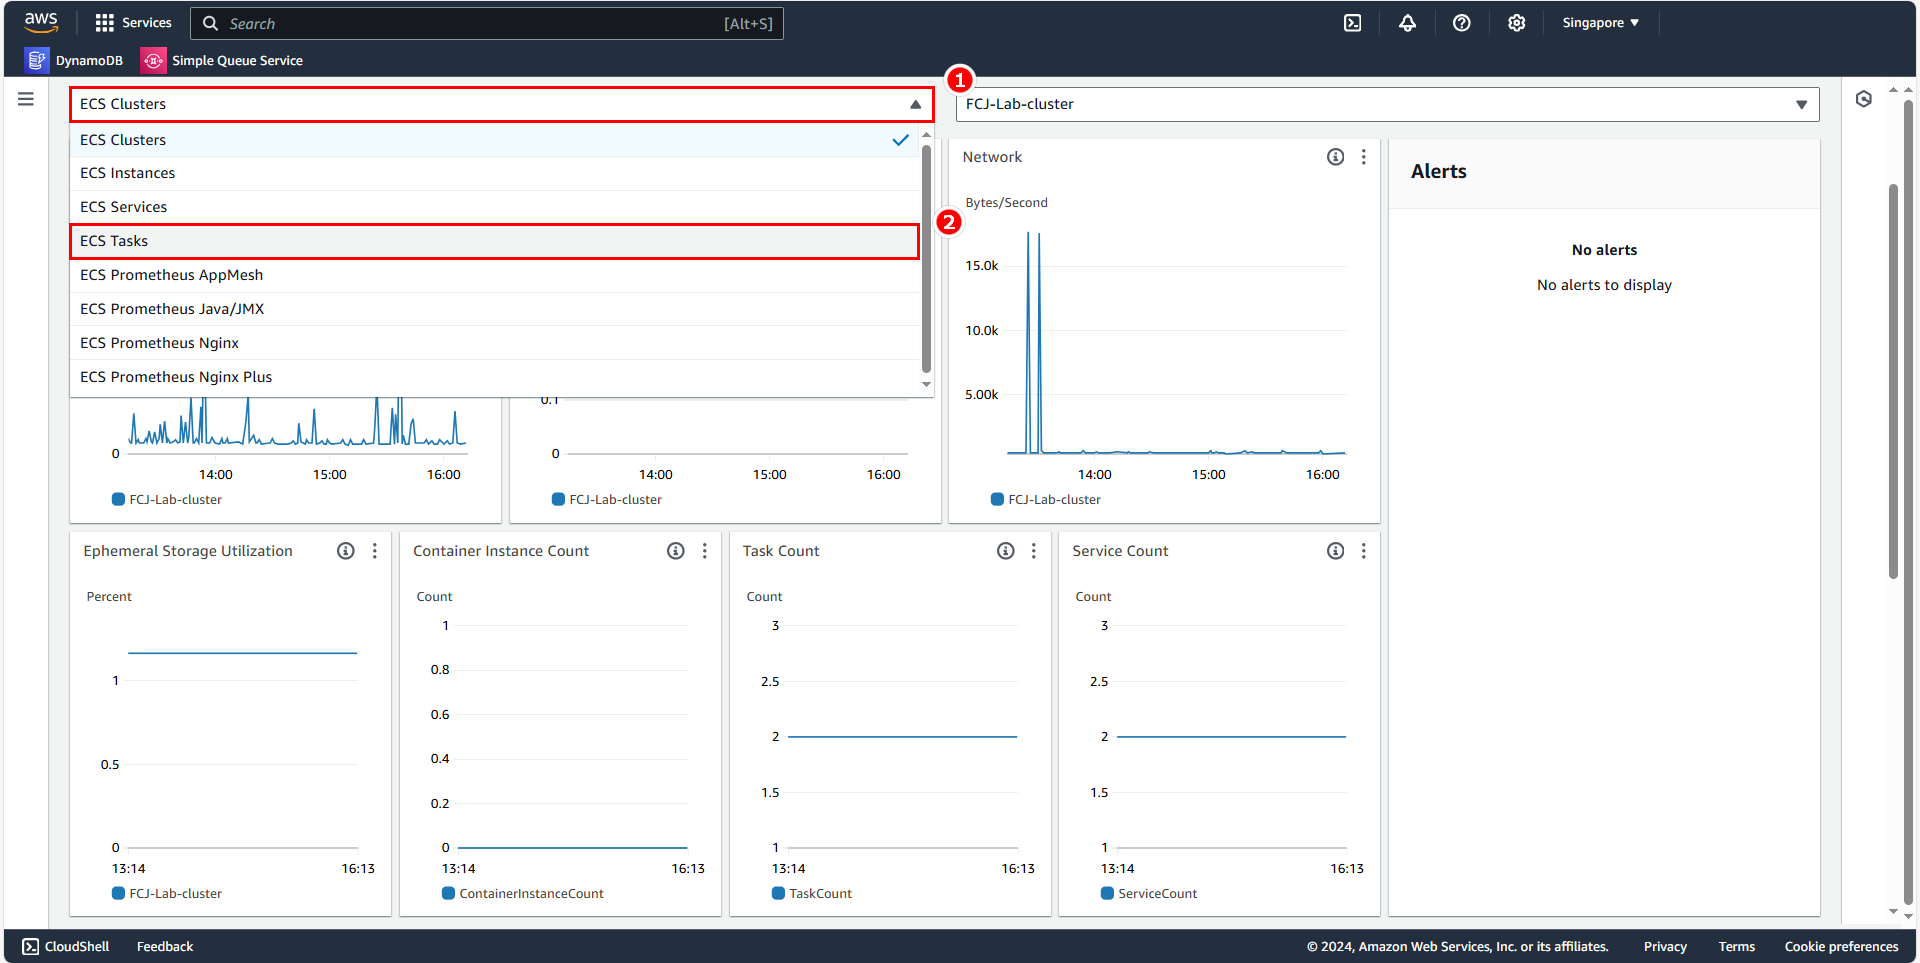
We can also view charts for various resources; in this case, we’ll select ECS Tasks.
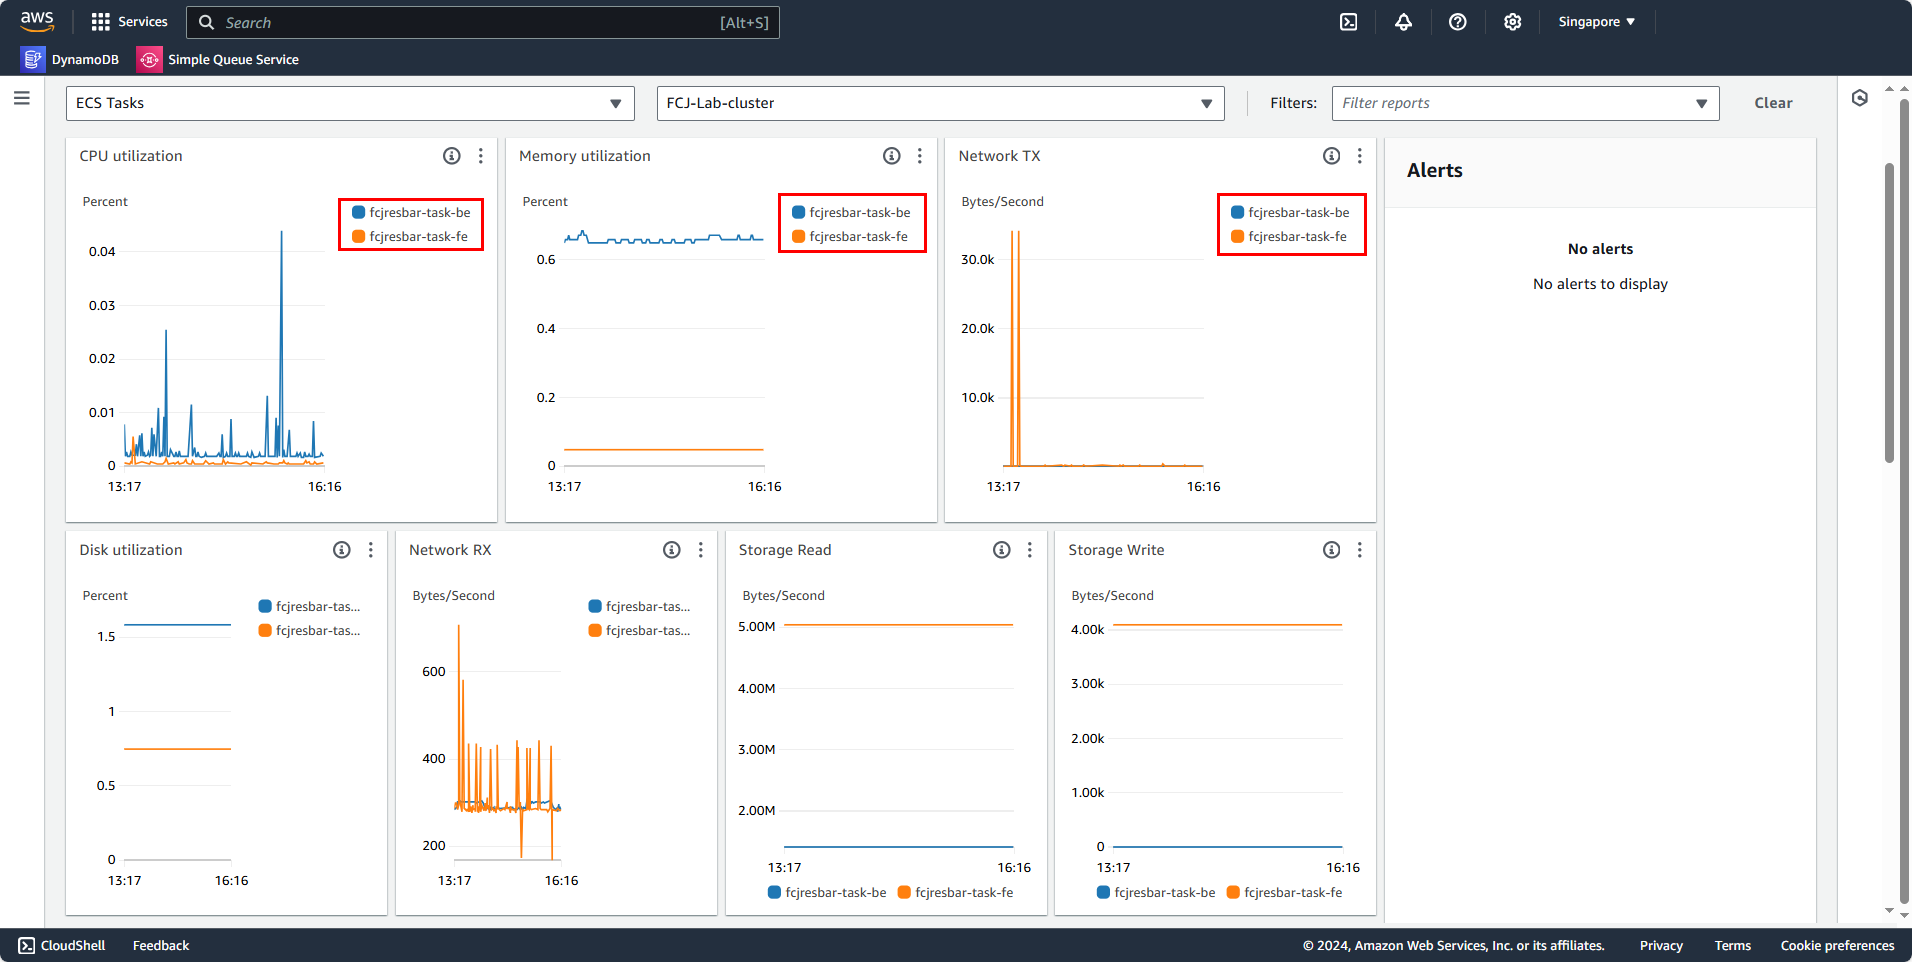
The chart will then display different tasks (including fcjresbar-task-fe and fcjresbar-task-be).
To view ECS Services.
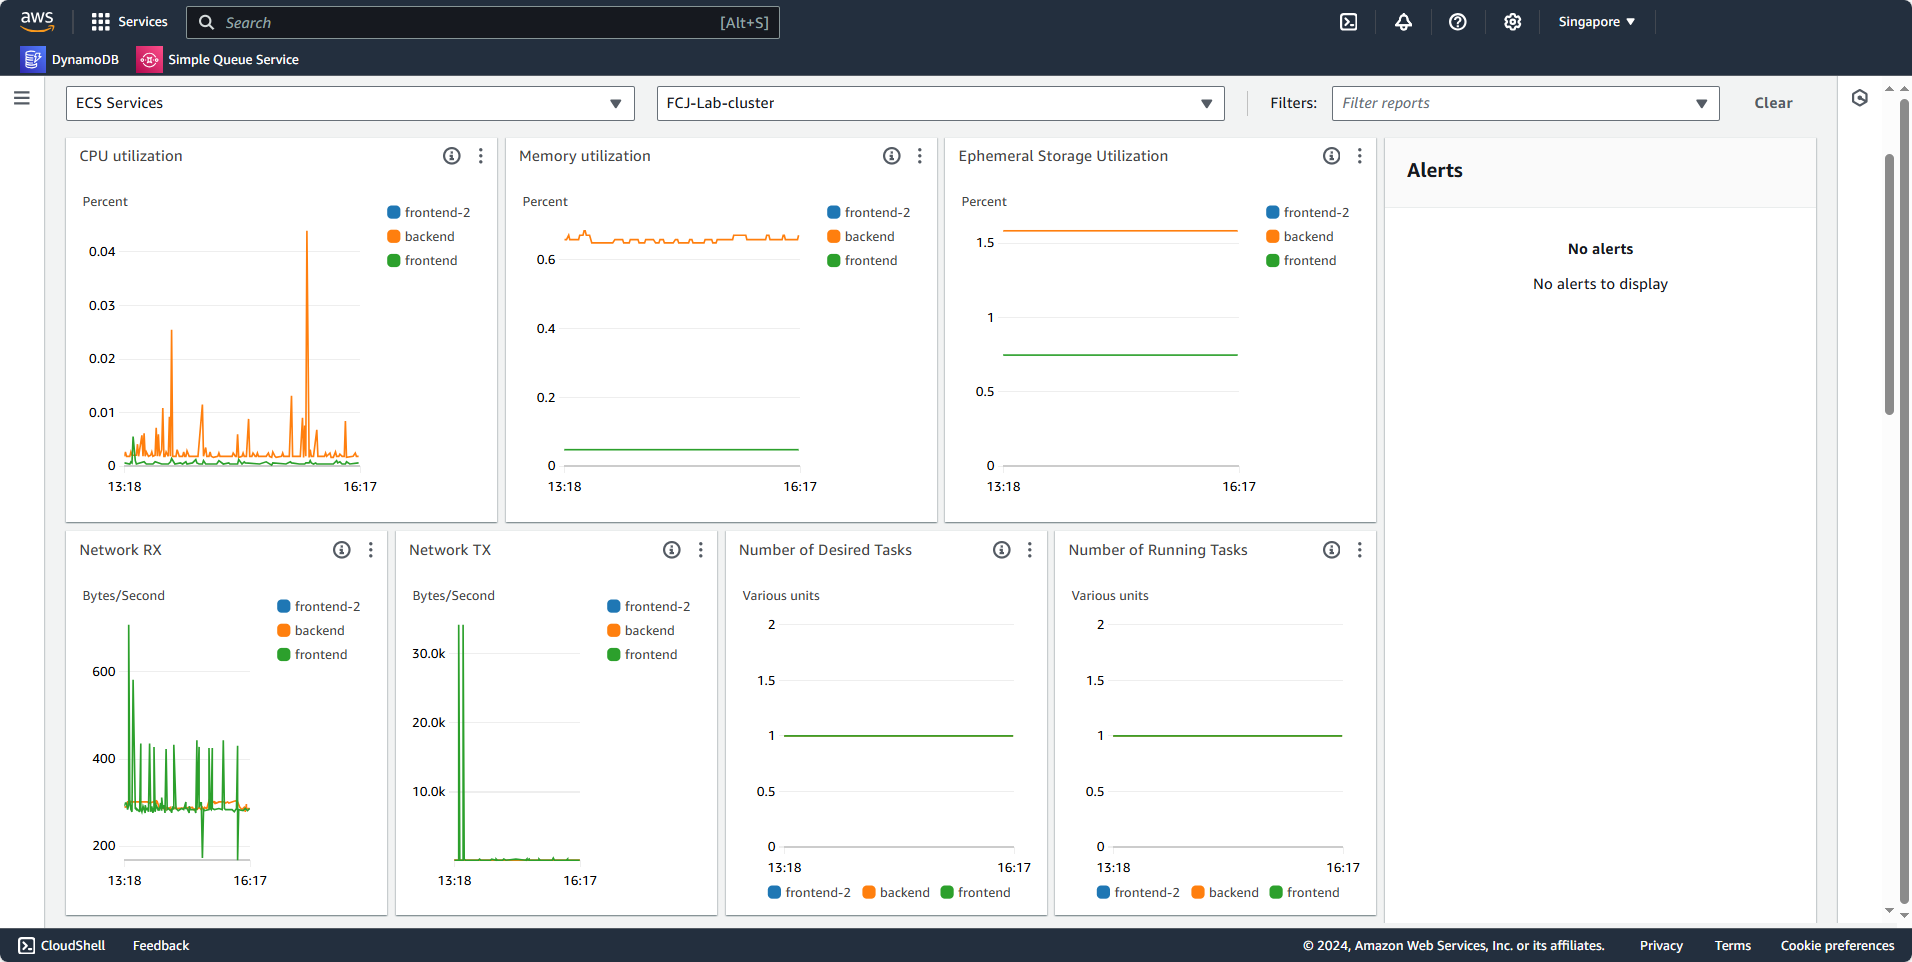
This is one way to view activity charts for Clusters, Services, Tasks, etc.
Observing Metrics with Container Map
In this section, you can view specific Containers, Tasks, Services, etc., in the deployed Cluster.
Switch from Performance Monitoring to Container Map.
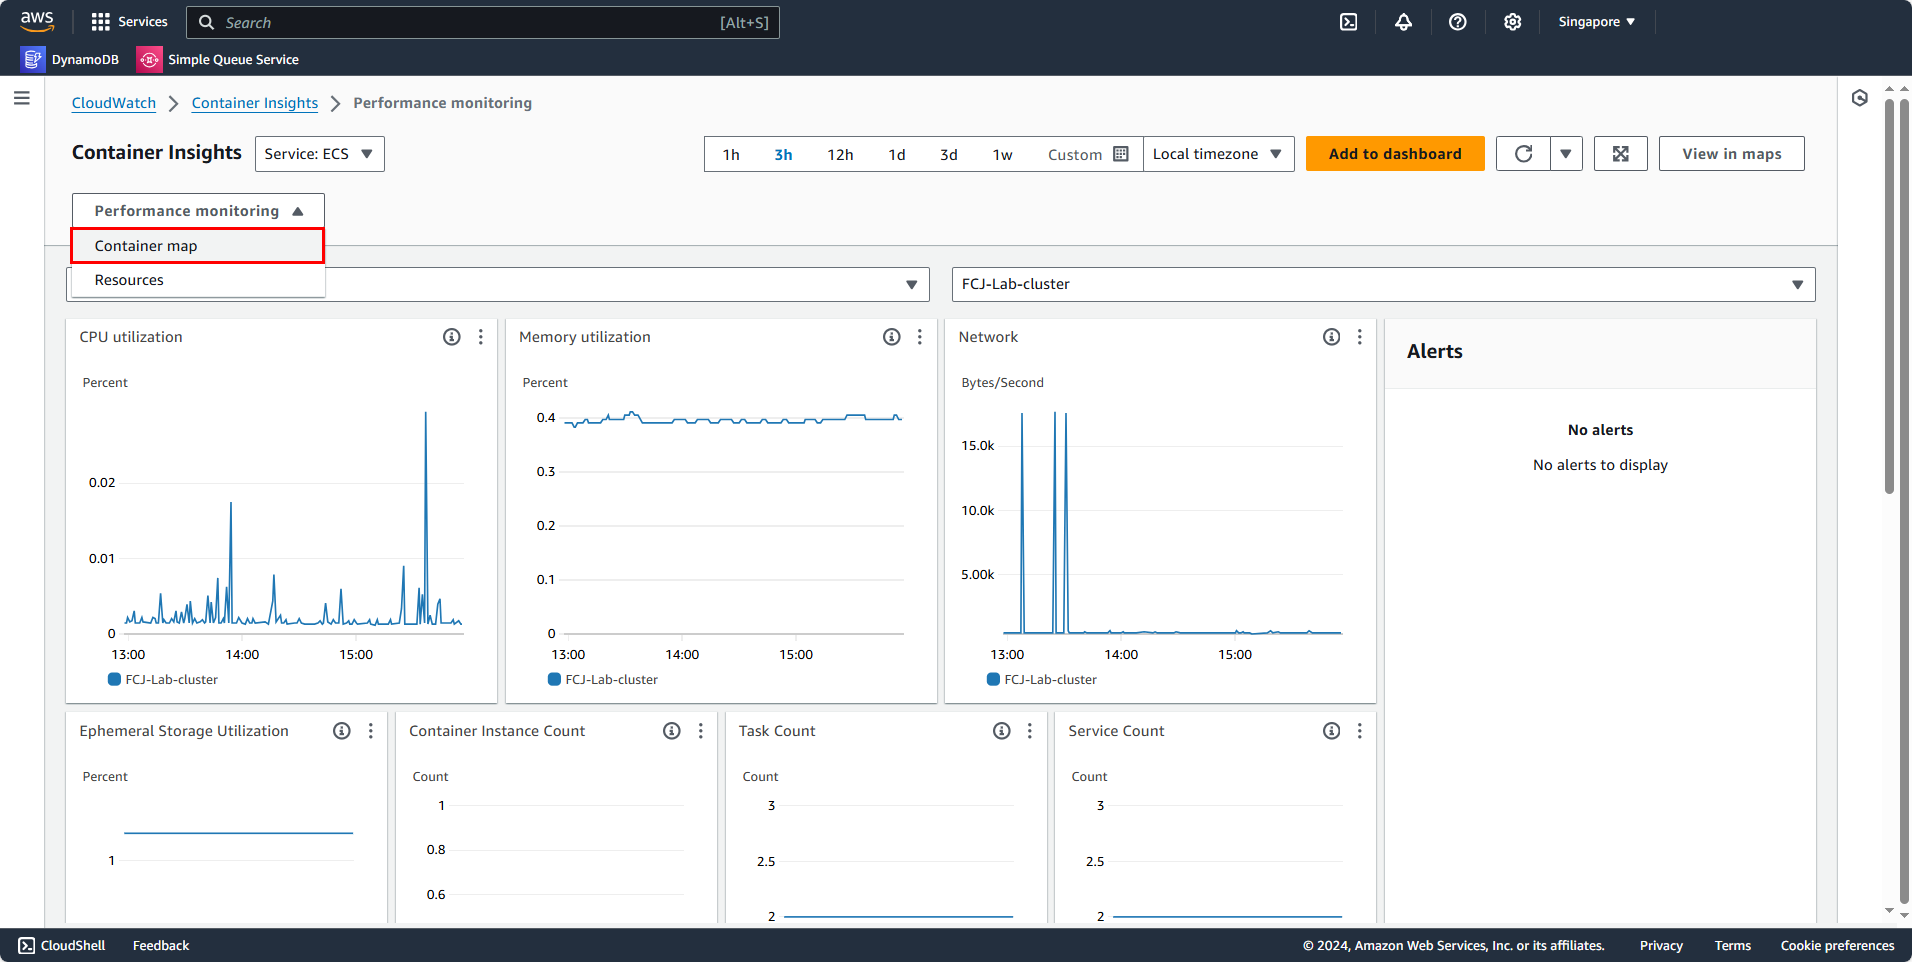
Then, you’ll see a new interface showing how a Cluster manages resources like Services and Tasks. However, metrics in a Task differ from those in a Service, as a Service directly manages Tasks; thus, Task metrics also belong to Service.
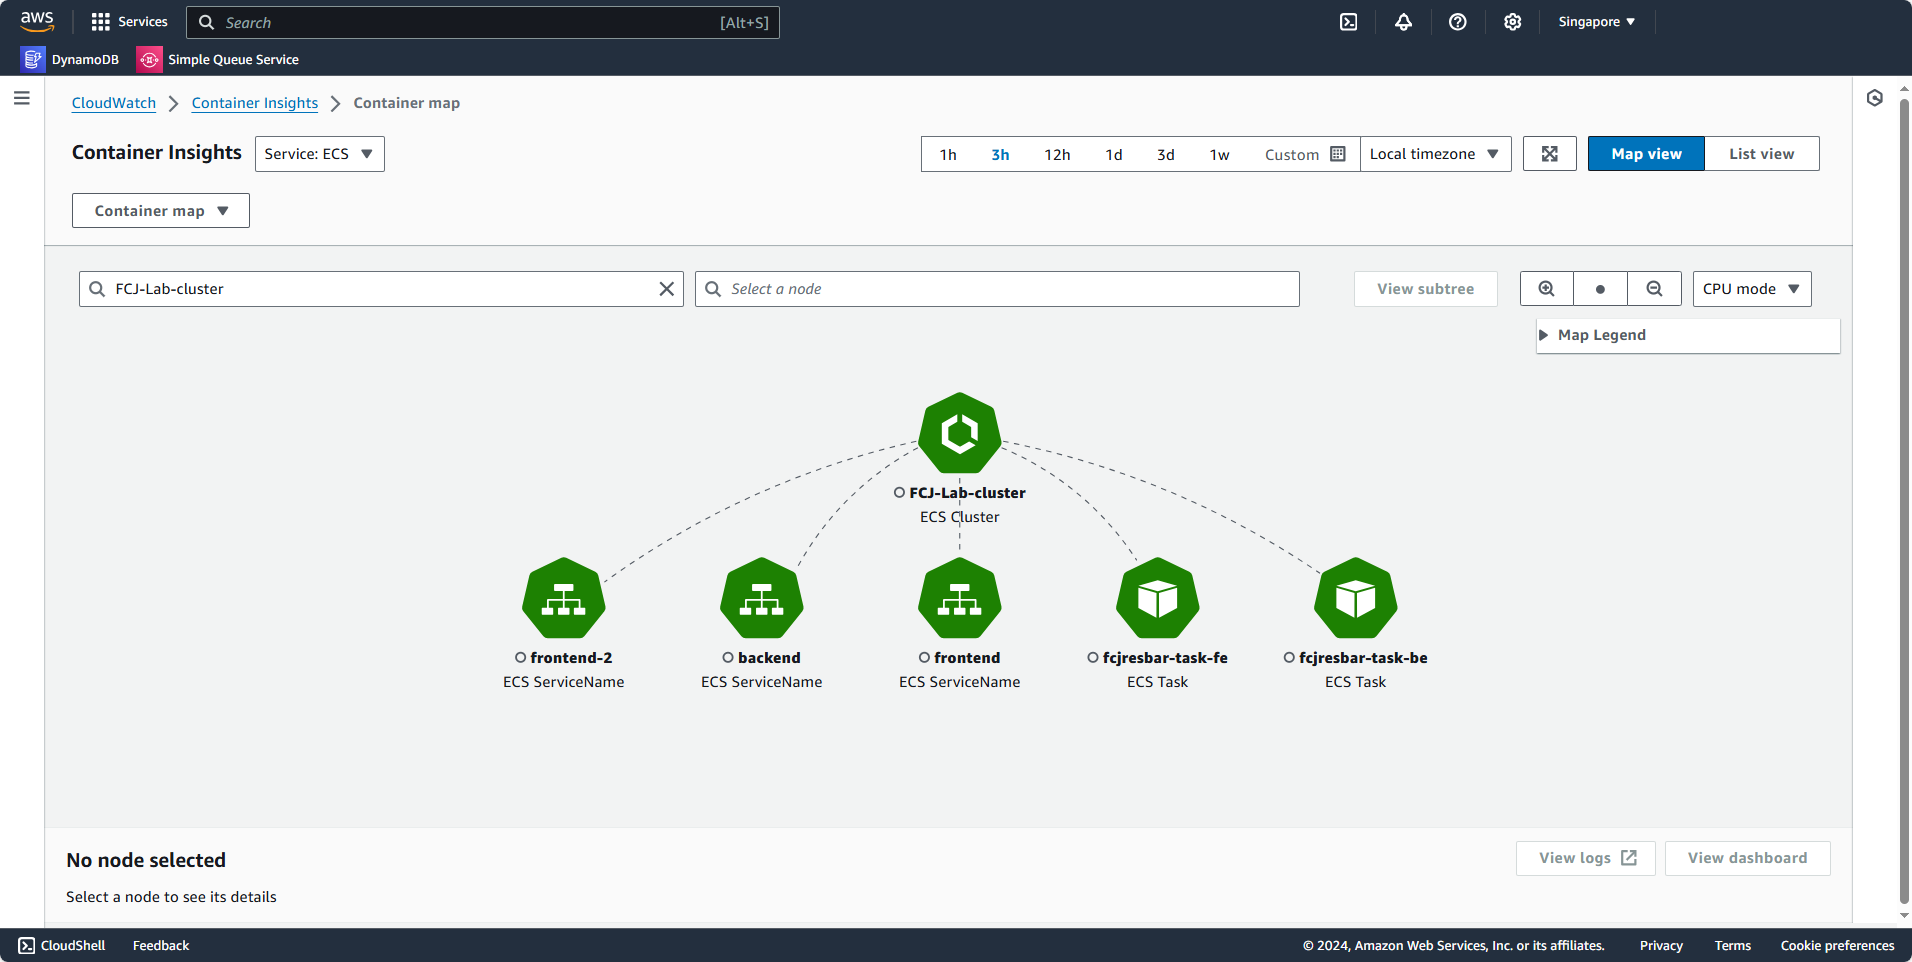
Click on the frontend service to view metrics within this service.
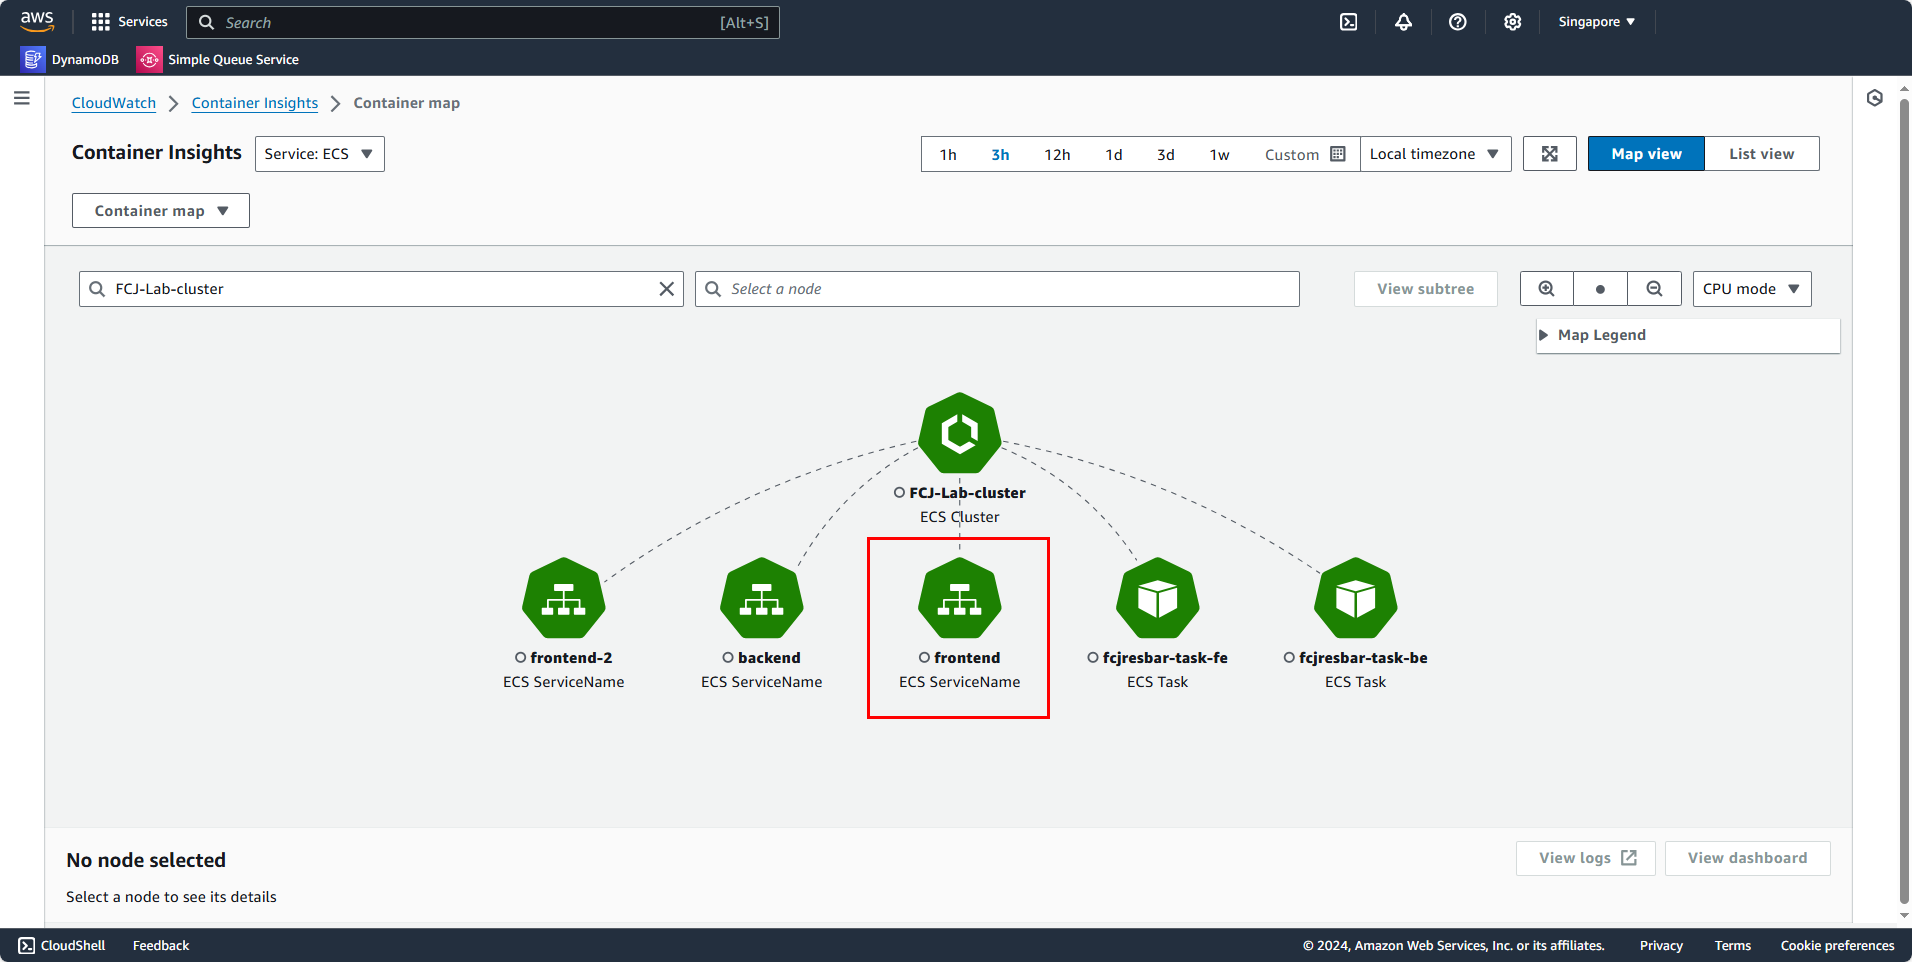
You can see basic metrics like CPU utilization, Memory utilization, Network, and Disk utilization.
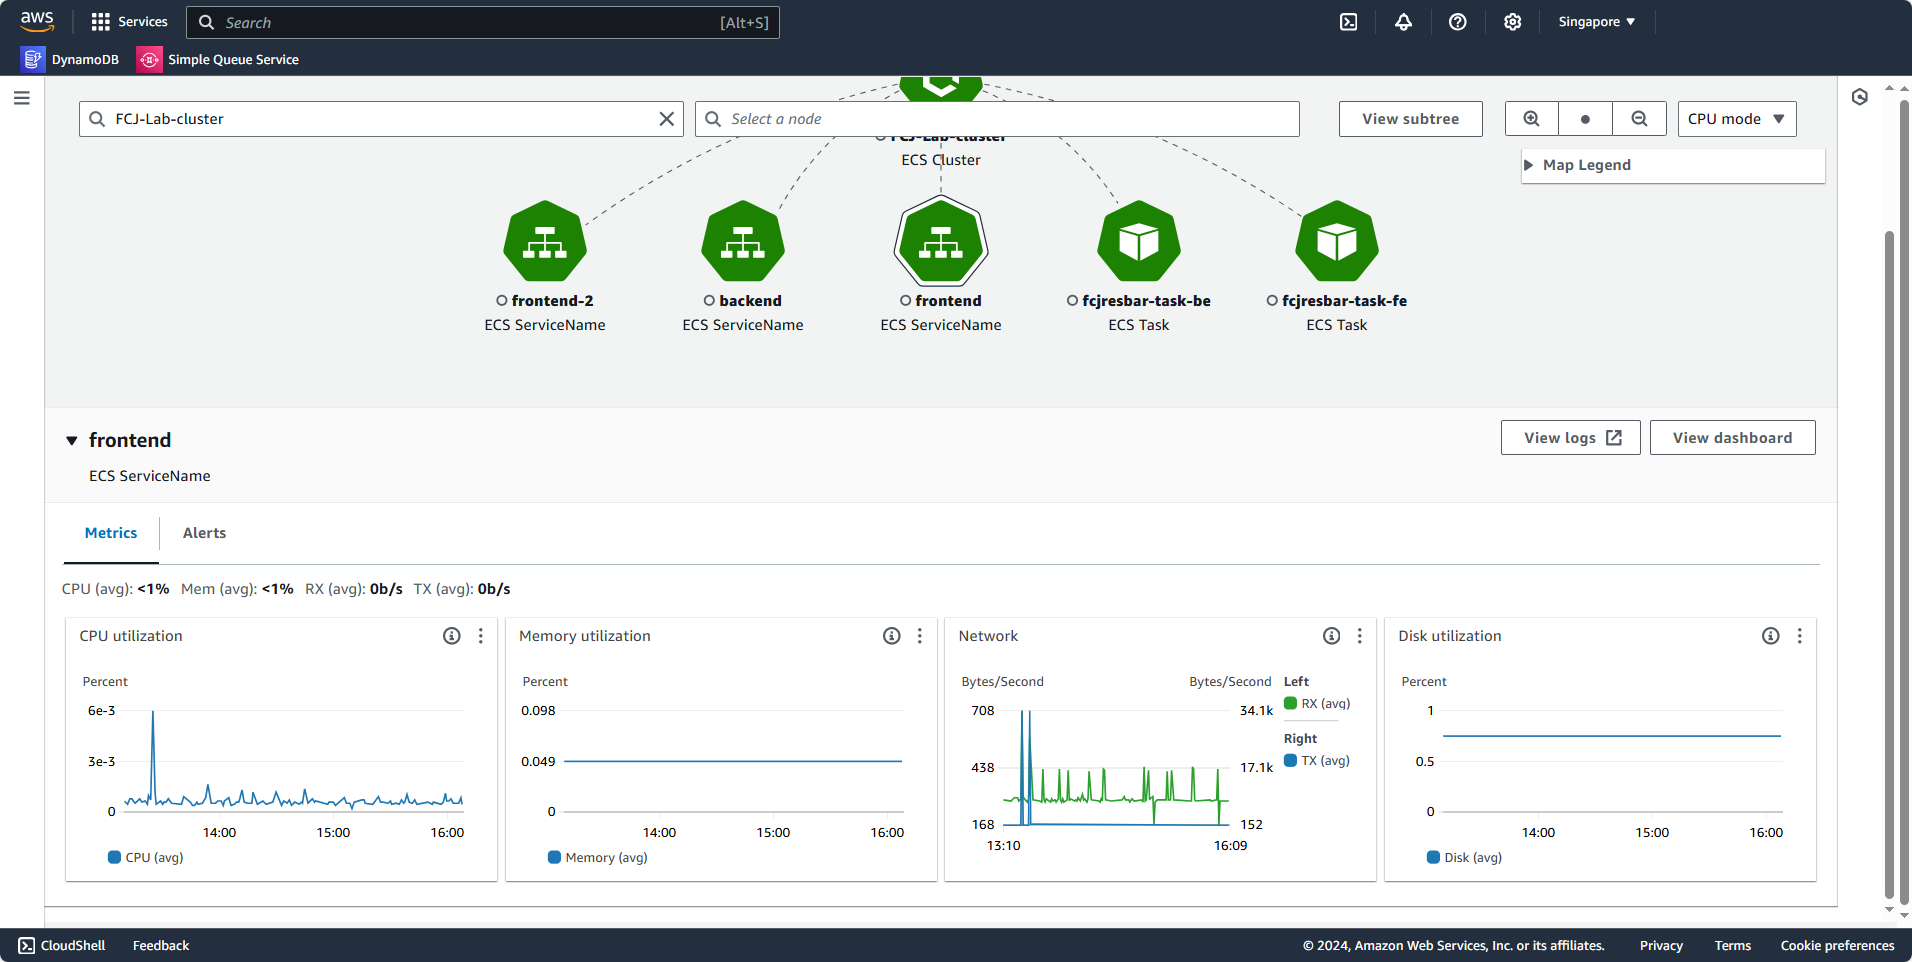
Now, to view a task, select fcjresbar-task-be.
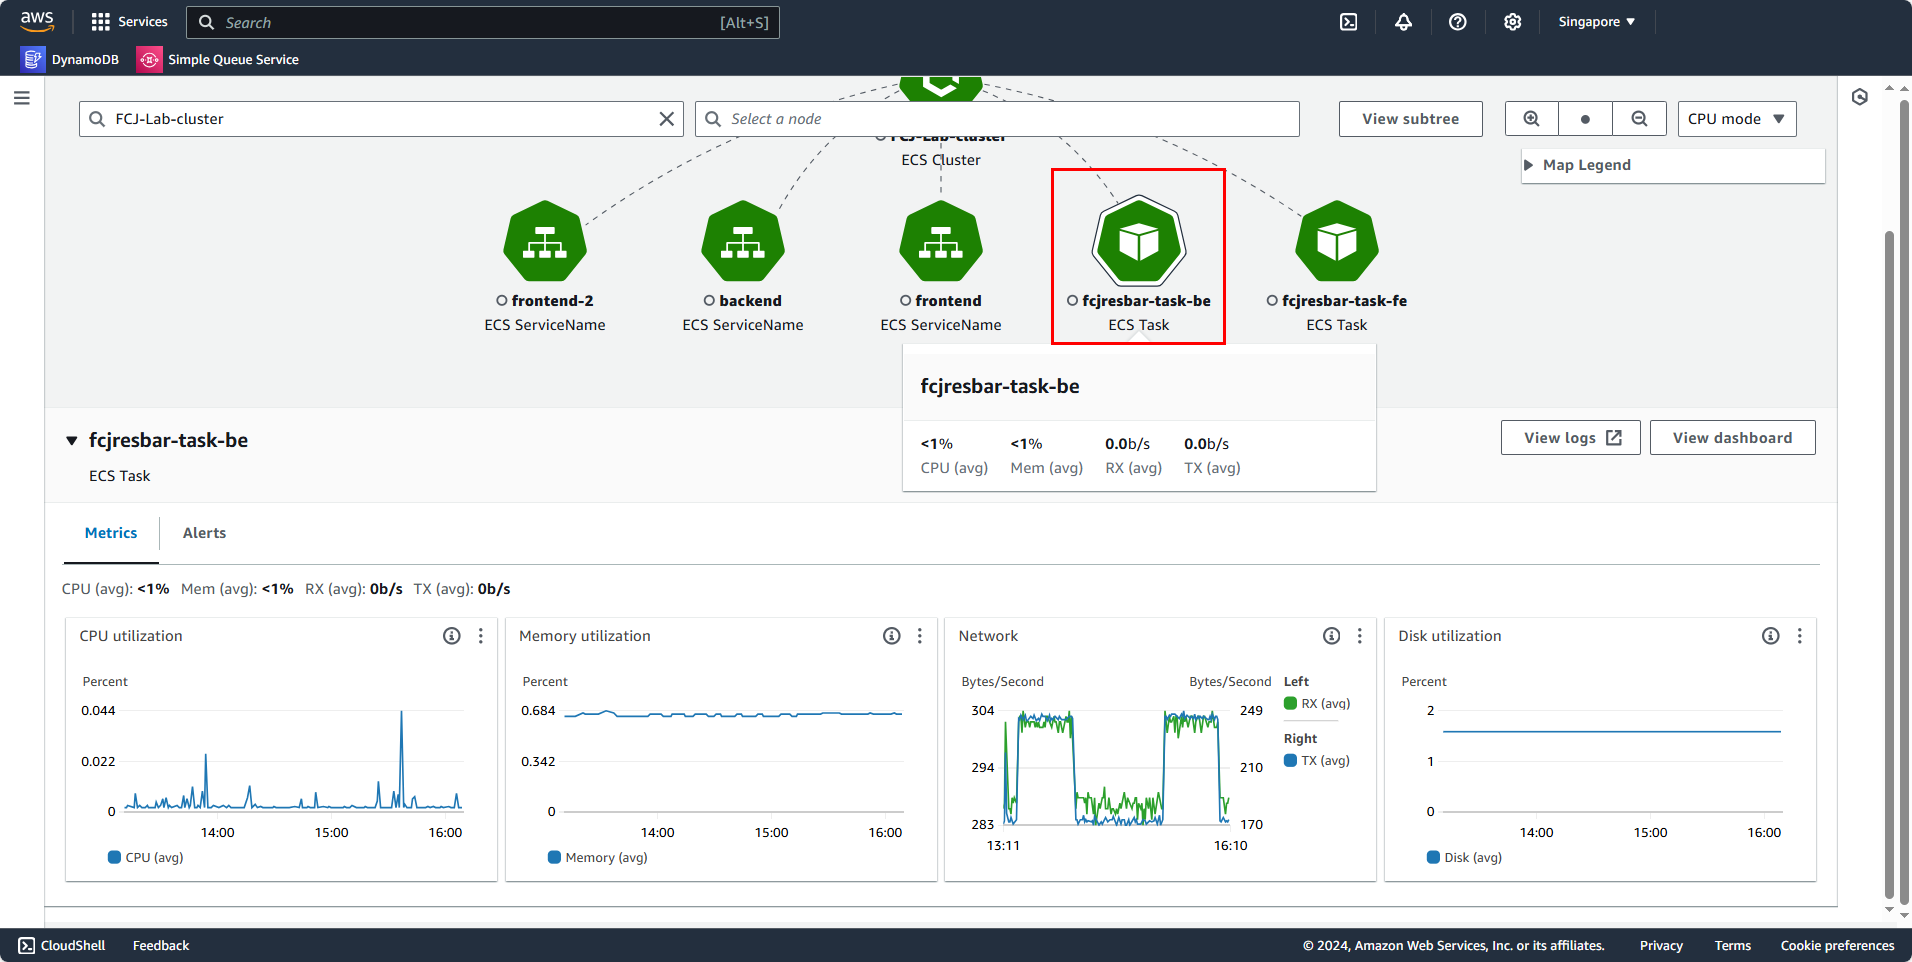
Thus, the Container Map provides a more detailed view of Services and Tasks within a Cluster.
Additionally, you can also use List View.
- Select Resources
- Select FCJ-Lab-cluster
This includes resources that were created and are currently running.
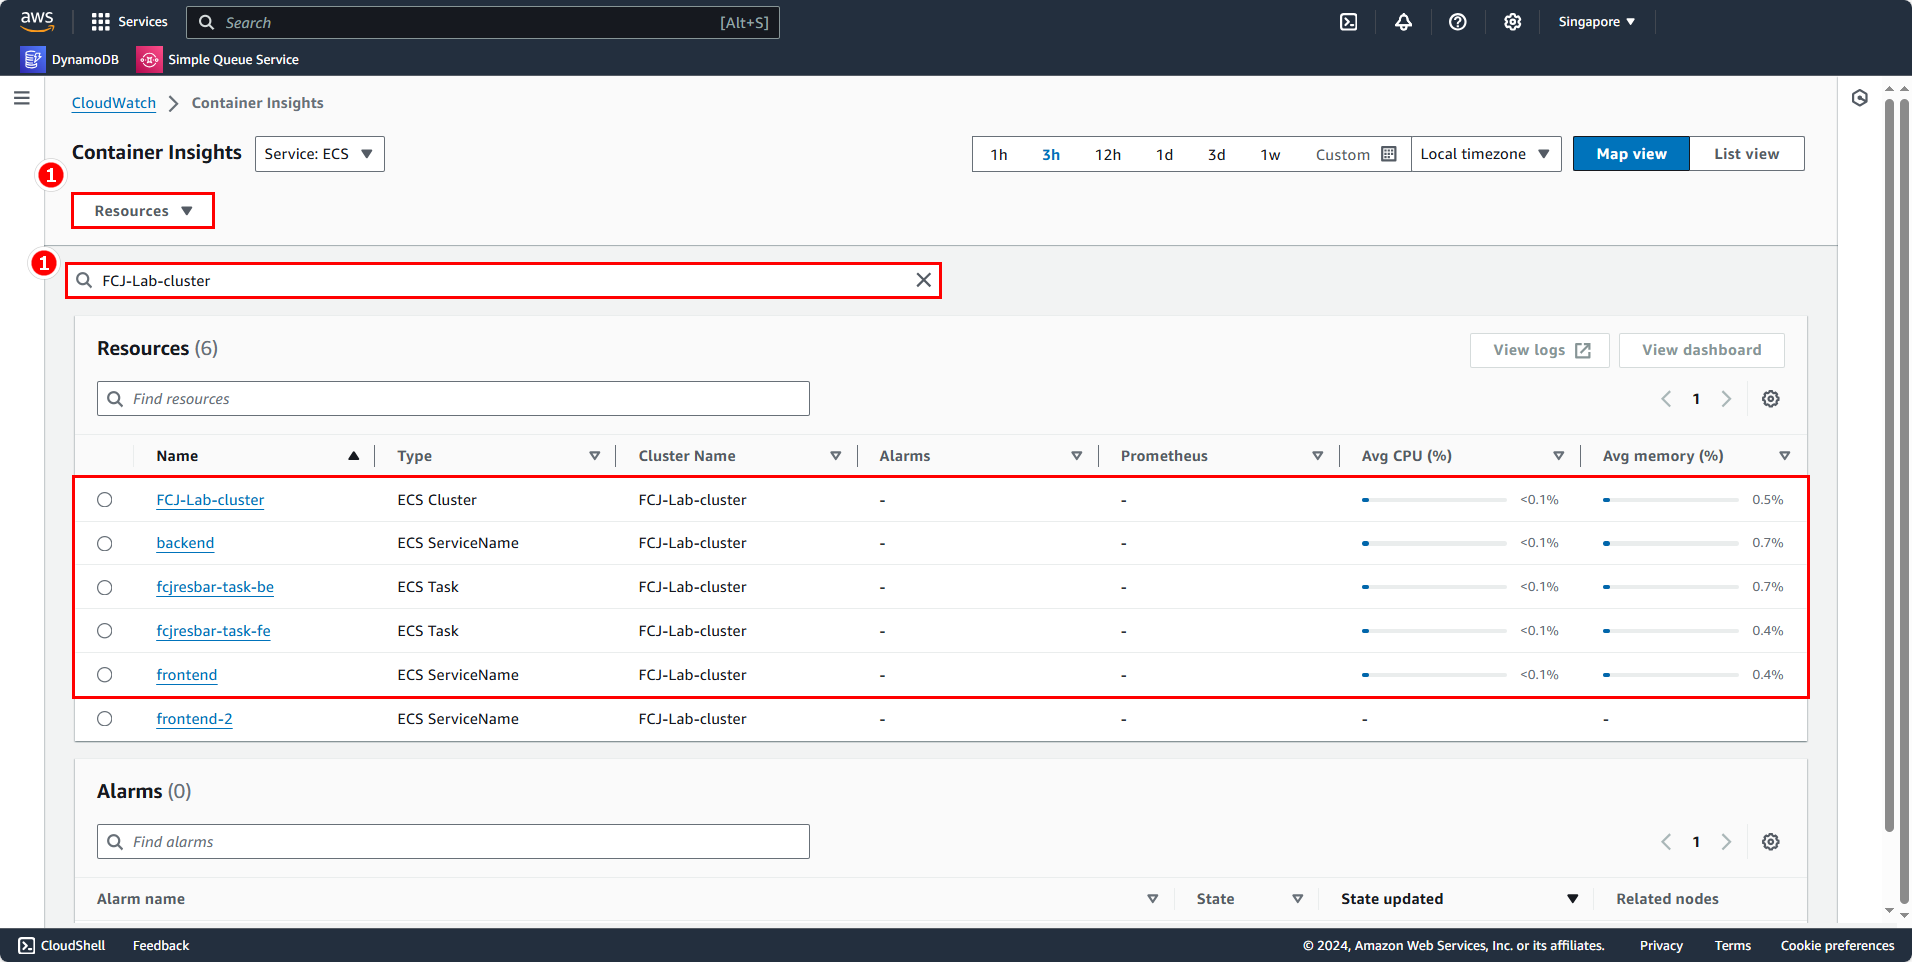
We can observe average usage for these resources over different time intervals, from 1 hour, 3 hours, 12 hours, 1 day, 1 week, etc.
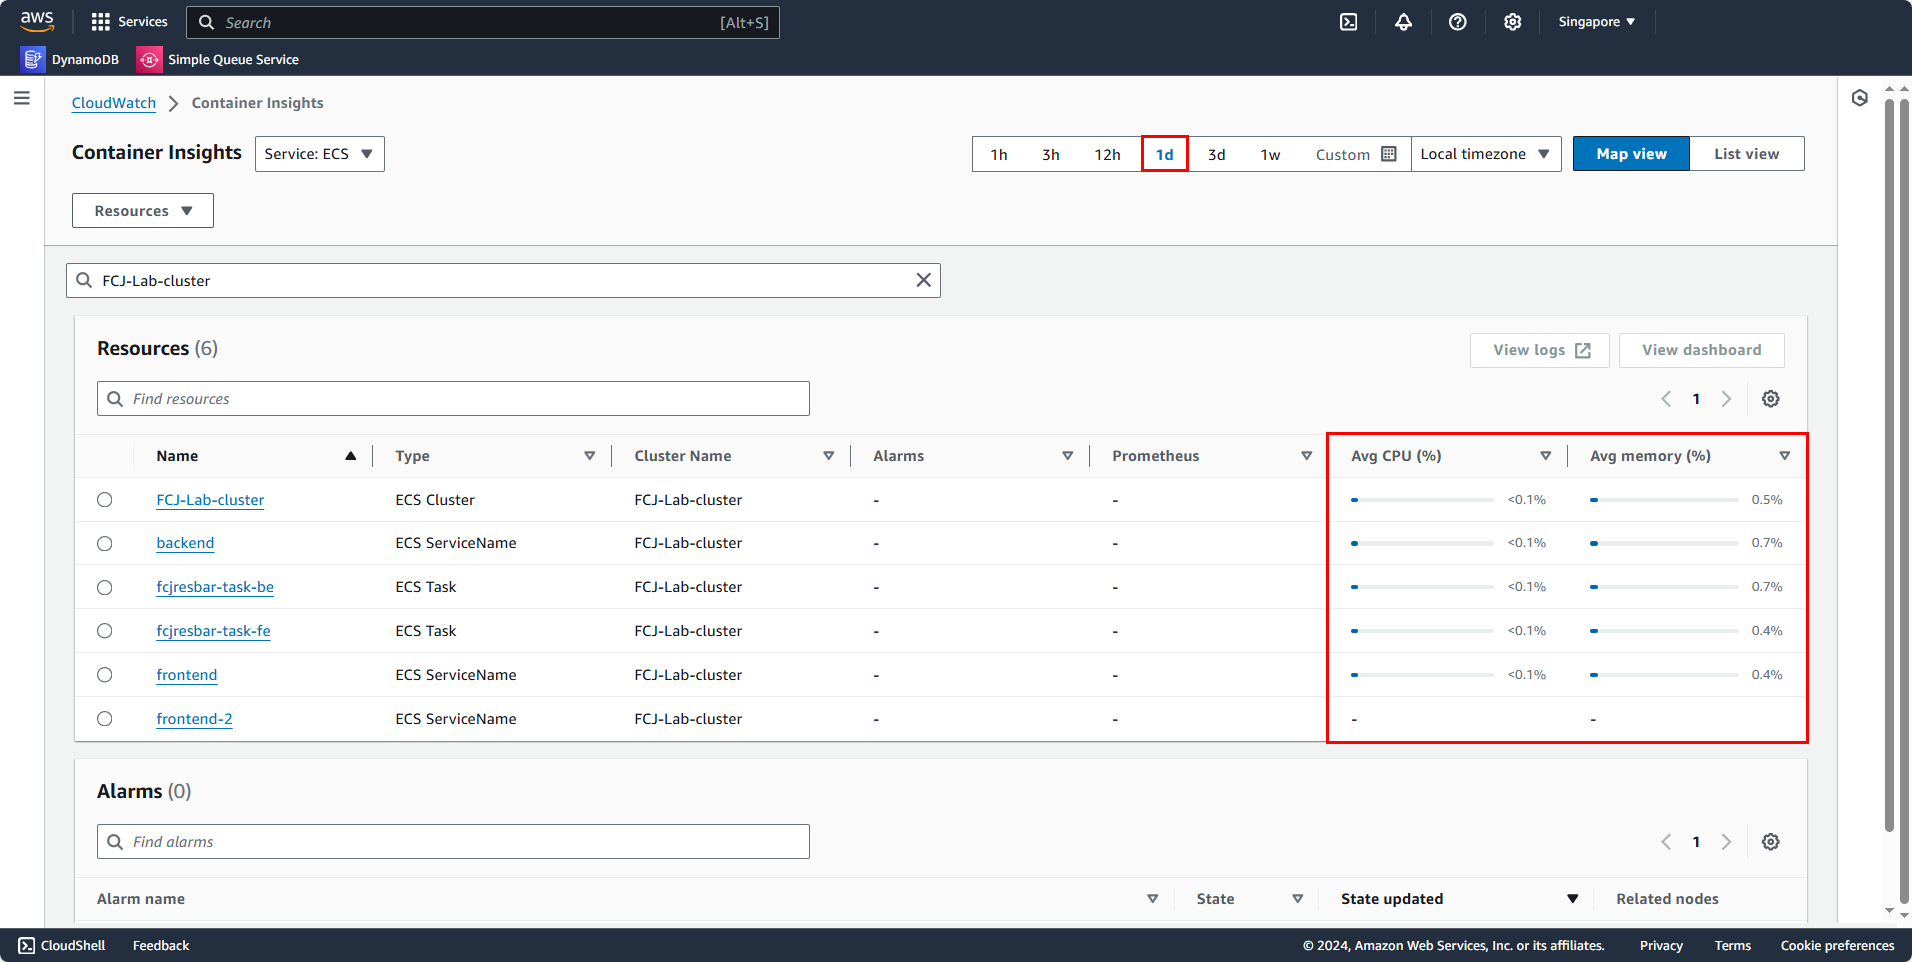
With this, we’ve configured and completed Container Insights observation. AWS isn’t limited to Container Insights for system monitoring; we can also use other services or third-party solutions for this purpose.
By default, ECS Container sends logs to CloudWatch. If you look in the Task Definition setup in previous workshops, logs can be routed to destinations like Amazon S3, Amazon EC2, or external services. To route these logs elsewhere, we need an application running in an ECS Service alongside the application whose logs we want to send. In the next section, we will configure FireLens to route logs to Amazon S3.